I am learning something outside of my comfort zone and these blogs will play host to my meaning-making. Please excuse my confusion as I sort new vocabulary and find my way. Any clarification of misconceptions or directions to sources of helpful information will be appreciated!
Purpose
My PhD supervisor (Dr. Valerie Irvine) set an early expectation of a well-rounded background in qualitative and quantitative research methods as part of my coursework. I have felt fearful of taking a “stats” course from the moment she assigned it! Math courses are traditionally test-based, and no matter how confident I am in the material I always feel very anxious about tests. I tend to overanalyze questions and doubt my ability to recognize answers. I spend more time deciphering what a question is asking than trusting my knowledge.
After a year of reading articles for assignments and in preparation for my lit review I can see the value in having a better understanding of statistics. In order to read and understand the statistics used in the literature, I will need to understand the process. I have noticed that I glaze over the tables in some articles and instead seek the meaning shared in the written summaries. Would I identify more trends or be more efficient when scanning articles if I was able to interpret these tables on my own?
Intention
I will use my strengths in language acquisition to develop statistical literacy. I will approach these new terms and equations like new vocabulary, grammar, and context. It may be unfamiliar, but with practice I will develop personal understanding and application.
Progress (What I have learned so far) and Questions
Personal Meaning
I am at the very beginning of my learning in this topic. I am currently wondering if SPSS and R are interchangeable? Can I use either/or for this course? I prefer Field’s SPSS (2017) text as opposed to his R (2012) text. It has been updated, there are more current examples, and he has grouped the information somewhat differently. However, the bulk of the statistics content (from my initial perusal) is the same, only the “environments” or tools are different. Long term I believe that I would get more use out of learning R as it is free to access and seems like a more popular tool with the students I have worked with in EDCI335.
Some bullet point “ah ha” moments so far:
- I didn’t realize that “statistics” is basically a numerical representation of a population (Johnson & Christensen, 2020). Understanding this definition offered meaning to an unfamiliar math label.
- I’ve already been “doing” introductory statistics with my students when I teach some data analysis operations. I did not see a connection between “statistics” and these activities. This helped alleviate some stress. Some of the terms are already familiar to me. Measures of central tendency and coordinate graphing are units that I teach in grade 7 math.
- There is a big book of statistics! (several, actually!) For example, Howell (2013). These books help you with calculating the margin of error. This answers a question I posed in my last class (finally found an answer!) when I was unsure of where the calculations of bias or error came from.
- I notice statistics more in regular life. For example, I can now interpret what some symbols or abbreviations stand for. I can now follow (some) of the data shared on Twitter about COVID-19 updates. I recognize Confidence Intervals. This helps increase my confidence in my ability to learn this language.
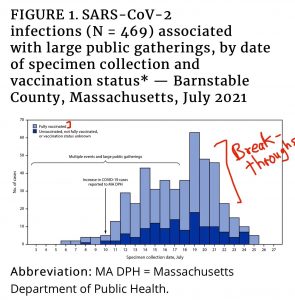
Image shared by @DrEricDing
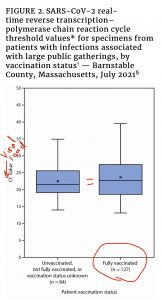
Image shared by @DrEricDing
I am seeking out other sources of information presented in bite-size chunks. As always, Youtube and TikTok continue to be helpful. @howie_hua is an awesome resource on both TikTok and Twitter, sharing out visualizations of math. This matches how I teach in my classroom. The video below helped me to see how the statistical data works in this instance. What I liked best about this video is that is also helped me to understand how statistics can be used to misrepresent data. The infection rates given vaccination status can be portrayed in a variety of ways (as he demonstrates) which is a great reminder to read data and articles critically. This was probably the best example to reinforce WHY I need to learn statistics.
@howie_hua The difference between P(vacc|infected) and P(infected|vacc) #math #mathematics #teacher #teachersoftiktok
Application for Thesis
I continue to plan towards a non-experimental approach in my data collection. This means I will need a strong grasp of correlational research methods and descriptive statistics. Understanding inferential statistics will help me while reading articles. Overall, having an understanding of the language, when and how different statistical analyses are used, and the ways in which we report these data will help me to read and report with a critical lens.
References
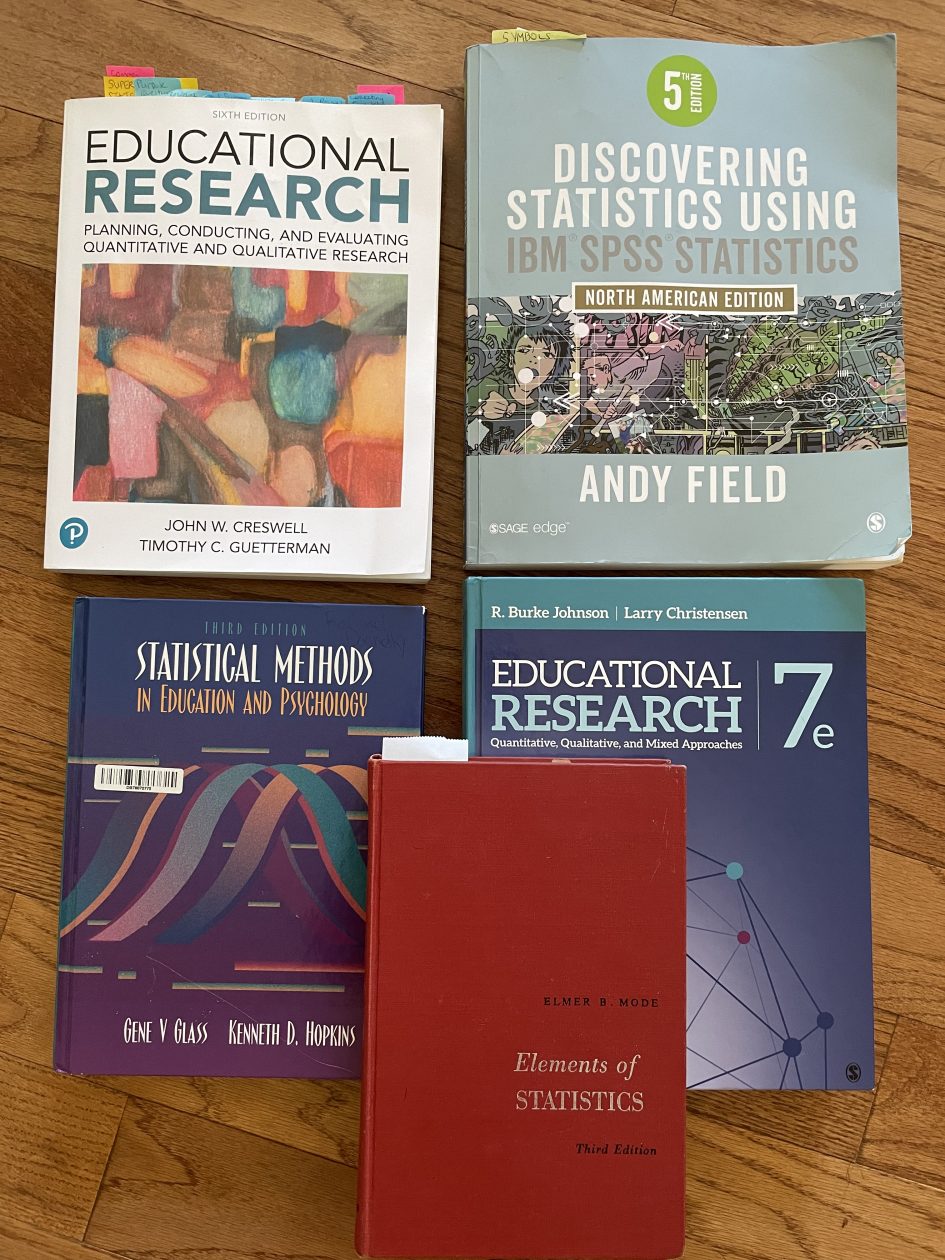
Creswell, J. W., Guetterman, T. C. (2019). Educational research planning, conducting, and evaluating quantitative and qualitative research (6th ed.). Pearson.
Field, A. (2017). Discovering statistics using IBM SPSS statistics (5th ed.). SAGE Publications.
Field, A. (2012). Discovering statistics using r. SAGE Publications.
Glass, G. V., & Hopkins, K. D. (1996). Statistical methods in education and psychology (3rd ed.). Allyn & Bacon.
Johnson, R. B., & L. Christensen. (2020). Educational Research: Quantitative, qualitative, and mixed approaches. 7th ed. SAGE.
Leave a Reply